A Report saves a completed calculation with a timestamp indicating when it was generated. You can use reports, for example, to compare old and new data. How to create and open reports is described in the following:
When you generate a Report, it saves the table currently loaded, including all associated output such as cross tables, parallel tables and graphs. Begin by running the calculations as you wish to have them stored, and then generate the Report:
1. Click on Report in the task bar:

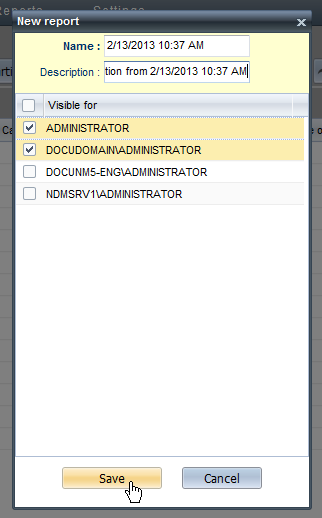
2. In the New report dialog, enter a name and a description of the report:

3. Under Visible for, select the users who will be permitted to open the Report. Users not selected here will not be able to see the Report listed anywhere.
![]() All reports are visible to administrators by default.
All reports are visible to administrators by default.
4. Click on Save. The Report is saved and is now available in the Report browser.
Reports are opened in the Report browser.
1. Open the Report browser by selecting Reports in the menu bar:

2. The Report browser shows all available Reports. Double-click on a Report to open it:

The Report contains all calculations that were available in the table at the time the report was generated. You can navigate the report in the same manner as you navigate any calculation.